
不可或缺的供應商:解構美國對台灣依賴的數據
Joe 盧, CFA | 2025年7月26日 美東時間
重點摘要
- 2024年,美國自台灣的進口額飆升至創紀錄的1163億美元。此成長是在2018年457億美元的基礎上攀升而來。此後,美國對台灣的貿易逆差擴大至739億美元。
- 此貿易關係以高科技產品為主導。機械和電子產業佔美國自台灣所有進口額的62.3%。這主要是由對電腦和AI基礎設施的需求所驅動。
- 美國在半導體領域深度依賴台灣。2024年,美國自台灣進口了價值119億美元的晶片,使其成為美國最大的晶片供應來源。台灣生產了全球超過90%的最先進晶片。
- 台灣亦是其他工業產品的關鍵供應商。美國的進口包括價值76億美元的基本金屬和工具。汽車產業是另一個主要類別,特斯拉(Tesla)75%的供應商為台灣廠商。
- 台灣專注於電子領域的策略推動了其成長。在全球AI熱潮的助燃下,台灣近期已超越日本和南韓,成為美國市場更大的商品來源國。

在緊張的氣氛中,全球經濟界正密切關注川普總統就對台灣進口商品加徵關稅的決定。這並非一次無足輕重的貿易調整。逼近的談判威脅著要擾亂一個已成為美國現代經濟核心支柱的戰略夥伴關係,危及每年價值超過1160億美元的商品流動。
美國與台灣之間的貿易關係是世界上最重要的關係之一,不僅在於其貨幣價值,更在於其戰略重要性。作為美國前十大貿易夥伴,台灣是驅動美國經濟的許多供應鏈中的關鍵節點。儘管對台灣的出口相當重要,但從數字上檢視美國自台灣進口的商品,揭示了美國對高價值、技術先進產品的深度依賴,這些產品對美國工業和消費者至關重要——此一趨勢近年來已急遽加速。
總體概況:貿易量的激增
美國與台灣之間的經濟夥伴關係以前所未有的速度深化,此轉變在進口數據中清晰可見。在經歷了多年的穩定成長後,美國自台灣的商品進口額從2019年的457億美元飆升至2024年創紀錄的1163億美元——在一年內實現了驚人的32.5%增長。此強勁的動能鞏固了台灣作為美國市場第八大商品來源國的地位。
此進口熱潮的直接後果是美國對台灣的商品貿易逆差相應擴大,在2024年達到739億美元。這不僅僅是一個會計數字,而是一個可量化的全球供應鏈戰略重組的症狀,主要由美國努力降低對中國大陸的風險所驅動。

圖表一:進口激增與逆差擴大
從2014年到2024年美國自台灣的進口額(折線)和美國對台灣的貿易逆差(長條)的急遽攀升。
資料來源:美國普查局
電子產業巨擘
解構總進口價值,可見此關係絕大多數由高科技產品所界定。2022年,主要類別「機械及機械用具」佔美國自台灣所有進口額的62.3%,價值約725億美元。此產業是此貿易關係毋庸置疑的核心。
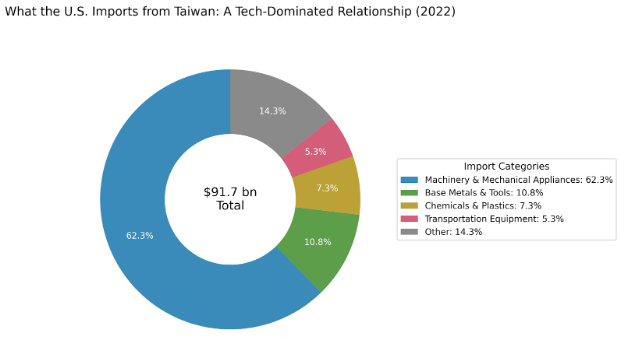
圖表二:貿易關係的組成
細分美國自台灣的主要進口類別。資料來源:美國工業和安全局
在此主導類別中,有兩個領域尤為突出:
- 電腦和數據處理設備:這是領先的子類別,受到像人工智慧(AI)這樣技術的爆炸性需求所推動。2024年,僅台灣出口至美國的「自動數據處理設備/零組件」就達到了驚人的515億美元,年增率達140%。
- 半導體(積體電路):這是最具戰略關鍵性的單一進口項目。2024年,美國直接從台灣進口了價值119億美元的半導體,使其成為美國最大的晶片供應國。然而,此原始美元價值低估了真正的依賴程度,因為還有數十億美元的晶片被嵌入在美國進口的電腦和伺服器中。鑑於台灣生產了全球約90%的最先進晶片,美國科技產業對此供應鏈有著深度的依賴。

圖表三:關鍵的半導體失衡
顯示美國自台灣進口的半導體。資料來源:經濟複雜性觀察站(OEC)
晶片之外:多元化的工業基礎
儘管科技產業絕大多數地定義了此進口關係,但台灣亦是其他工業和消費品的關鍵供應商,突顯了其製造能力的廣度。
- 基本金屬、鋼鐵及工具:這是第二大進口產業,在2022年佔進口額的10.8%。美國進口了價值76億美元的此類商品,涵蓋從結構鋼到關鍵工業扣件的各種產品。
- 汽車零組件:一個關鍵且不斷成長的類別,運輸設備在2022年佔進口額的5.3%。值得注意的是,特斯拉(Tesla)75%的供應商為台灣廠商,展示了台灣在電動車供應鏈中的關鍵角色。
- 化學品和塑膠:此產業在2022年佔進口額的7.3%,為美國各種工業提供必要的材料。
台灣出口的獨特組成,使其近期在美國市場上超越了其區域同儕。儘管日本和南韓的出口以汽車為主,但台灣在電子領域的集中使其得以利用AI驅動的科技熱潮,在2025年初成為比這兩國更大的對美商品來源國。
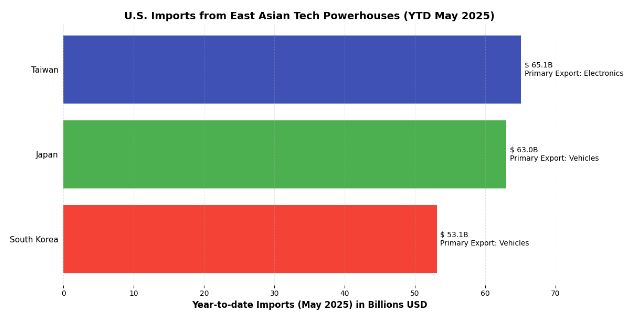
圖表四:台灣在區域層級中的崛起
比較年初至今美國自台灣、日本和南韓的進口價值。資料來源:美國普查局
貿易的本質:對中間產品的依賴
關於美國自台灣1163億美元進口額,一個需要理解的關鍵點是中間產品的普遍性。與專注於成衣或玩具等終端消費品的貿易關係不同,美國主要從台灣進口零組件和資本財,這些是其自身國內工業的必要投入品。
台積電(TSMC)的半導體被整合到德州組裝的戴爾(Dell)伺服器中。台中的工具機被安裝在俄亥俄州的工廠裡。汽車零組件被裝配到密西根州的汽車上。
此種動態意味著美台貿易關係與其說是消費關係,不如說是工業上的相互依賴。美國不僅依賴台灣的終端產品,更依賴那些使其自身先進製造和技術領導地位成為可能的關鍵高科技零組件。此一由數十億美元專業化進口所量化的現實,是美國貿易政策和旨在確保21世紀最重要供應鏈安全的戰略倡議之主要驅動力。
▶立即付費訂閱華爾街脈動,解鎖深度見解(點此前往)!
▶加入LINE好友了解付費方案!
👍若您覺得這份研究有價值,請對本文按讚。
📲加入並追蹤鉅亨號,與我們互動,即可獲取更多趨勢指標和市場資訊。
📰追蹤此部落格。
💬LINE好友。
➡️將此分析分享給您的親朋好友,一同獲取最新投資觀點。
本電子報僅供參考,不構成任何證券或資產類別的投資建議或買賣推薦。文中所表達的觀點為作者截至發布日期的觀點,如有變動,恕不另行通知。所呈現的資訊乃基於從相信可靠的來源所獲取的數據,但其準確性、完整性和及時性不作保證。過往表現並非未來結果的指標。投資涉及風險,包括可能損失本金。讀者在做出任何投資決策前,應諮詢其財務顧問。作者及相關實體可能持有本文所討論的資產或資產類別的部位。
U.S. Imports from Taiwan: A By-the-Numbers Look at a Critical Trade Partnership
The Indispensable Supplier: Deconstructing the Numbers Behind America's Reliance on Taiwan
By Joe 盧, CFA | July 26, 2025
Executive Summary
- U.S. imports from Taiwan have surged to a record $116.3 billion in 2024. This growth followed a climb from $45.7 billion in 2018. The U.S. trade deficit with Taiwan has widened since then to $73.9 billion.
- The trade relationship is dominated by high-technology goods. The machinery and electronics sector makes up 62.3% of all U.S. imports from Taiwan. This is driven by demand for computers and AI infrastructure.
- The U.S. is deeply reliant on Taiwan for semiconductors. It imported $11.9 billion in chips from Taiwan in 2024, making it the top supplier. Taiwan produces over 90% of the world's most advanced chips.
- Taiwan is also a key supplier of other industrial goods. U.S. imports include $7.6 billion in base metals and tools. The automotive sector is another major category, with 75% of Tesla's suppliers being Taiwanese.
- Taiwan's specialized focus on electronics has propelled its growth. It has recently surpassed both Japan and South Korea as a source of goods for the U.S. market, fueled by the global AI boom.
In an atmosphere of intense suspense, the global economic community is intently watching for a decision from President Donald Trump regarding the imposition of tariffs on Taiwanese imports. This is no minor trade adjustment. The looming negotiations threaten to disrupt a strategic partnership that has become a central pillar of the U.S. modern economy, putting at risk a flow of goods valued at over $116 billion annually.
The trade relationship between the United States and Taiwan is one of the most significant in the world, not just for its monetary value, but for its strategic importance. As a top-ten trading partner for the U.S., Taiwan is a crucial node in many of the supply chains that power the American economy. While exports to Taiwan are significant, a by-the-numbers look at what the U.S. imports from Taiwan reveals a deep reliance on high-value, technologically advanced goods that are essential for American industry and consumers—a trend that has accelerated dramatically in recent years.
The Macro Picture: A Surge in Trade Volume
The economic partnership between the U.S. and Taiwan has deepened at an unprecedented rate, a shift clearly visible in the import data. After years of steady growth, U.S. goods imports from Taiwan surged from $45.7 billion in 2019 to a record $116.3 billion in 2024—a remarkable 32.5% increase in a single year. This powerful momentum has cemented Taiwan's position as the 8th-largest source of goods for the U.S. market.
A direct consequence of this import boom has been a corresponding expansion of the U.S. goods trade deficit with Taiwan, which reached $73.9 billion in 2024. This is not merely an accounting figure but a quantifiable symptom of a strategic realignment of global supply chains, driven largely by U.S. efforts to de-risk from mainland China.
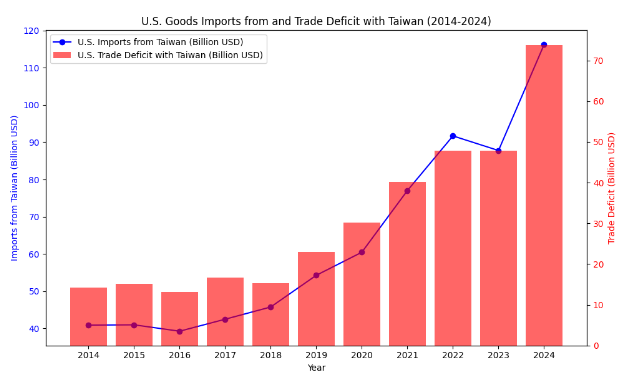
Exhibit 1: The Import Surge and Widening Deficit
A combination line and bar chart illustrating the steep climb in both U.S. imports from Taiwan (line) and the U.S. trade deficit with Taiwan (bars) from 2014 to 2024.
Source: U.S. Census Bureau
The Electronics Juggernaut
Deconstructing the aggregate import value reveals a relationship overwhelmingly defined by high-technology goods. The primary category, Machinery & Mechanical Appliances, accounted for an immense 62.3% of all U.S. imports from Taiwan in 2022, with a value of approximately $72.5 billion. This sector is the undisputed core of the trade relationship.

Exhibit 2: Composition of the Trade Relationship
A donut chart or treemap visually breaking down the major U.S. import categories from Taiwan by percentage.
Source: U.S. Bureau of Industry and Security
Within this dominant category, two areas stand out:
- Computers and Data Processing Equipment: This is the leading sub-category, fueled by explosive demand for technologies like artificial intelligence. In 2024, Taiwan's exports of "automatic data processing equipment/components" to the U.S. alone reached an astonishing $51.5 billion, a 140% year-on-year increase.
- Semiconductors (Integrated Circuits): This is the single most strategically critical import. In 2024, the U.S. imported $11.9 billion worth of semiconductors directly from Taiwan, making it the number one supplier of chips to the United States. However, this raw dollar value understates the true dependency, as billions more are embedded within the computers and servers the U.S. imports. Given that Taiwan produces an estimated 90% of the world's most advanced chips, the U.S. technology sector is profoundly reliant on this supply.
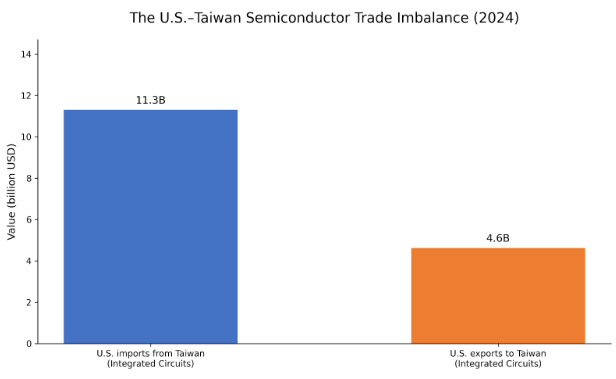
Exhibit 3: The Critical Semiconductor Imbalance
A side-by-side bar chart showing U.S. imports of semiconductors from Taiwan
Source: OEC
Beyond the Chips: A Diversified Industrial Base
While technology overwhelmingly defines the import relationship, Taiwan also serves as a key supplier of other industrial and consumer goods, highlighting the breadth of its manufacturing capabilities.
- Base Metals, Iron, Steel, and Tools: This is the second-largest import sector, accounting for 10.8% of imports in 2022. The U.S. imported $7.6 billion worth of these goods, which includes everything from structural steel to critical industrial fasteners.
- Automotive Parts: A crucial and growing category, transportation equipment accounted for 5.3% of imports in 2022. A striking 75% of Tesla's suppliers are Taiwanese, showcasing the island's key role in the electric vehicle supply chain.
- Chemicals and Plastics: This sector represented 7.3% of imports in 2022, supplying essential materials for a variety of U.S. industries.
The unique composition of Taiwan’s exports has recently propelled it past its regional peers in the U.S. market. While Japan and South Korea’s exports are dominated by vehicles, Taiwan’s concentration in electronics allowed it to capitalize on the AI-driven tech boom, making it a larger source of goods for the U.S. than both countries in early 2025.
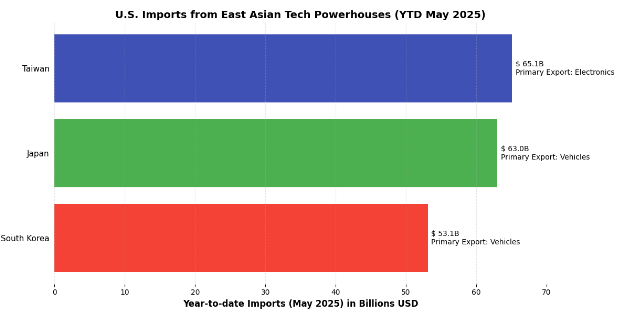
Exhibit 4: Taiwan's Rise in the Regional Hierarchy
A horizontal bar chart comparing year-to-date U.S. import values from Taiwan, Japan, and South Korea.
Source: U.S. Census Bureau
The Nature of the Trade: A Reliance on Intermediate Goods
A critical point to understand about the $116.3 billion in U.S. imports from Taiwan is the prevalence of intermediate goods. Unlike trade relationships focused on finished consumer products like apparel or toys, the U.S. largely imports components and capital goods from Taiwan that are essential inputs for its own domestic industries.
A semiconductor from TSMC is integrated into a Dell server assembled in Texas. A machine tool from Taichung is installed in a factory in Ohio. An automotive component is built into a vehicle in Michigan.
This dynamic means the U.S.-Taiwan trade relationship is less about consumption and more about industrial co-dependence. The U.S. relies on Taiwan not just for finished products, but for the critical, high-tech components that enable its own advanced manufacturing and technological leadership. This reality, quantified by the billions of dollars in specialized imports, is a primary driver of U.S. trade policy and strategic initiatives aimed at securing the most vital supply chains of the 21st century.
▶ Subscribe now to unlock in-depth insights (click here)!
▶ Add LINE friends to learn about subscription plans!
👍'Like' this article if you found this research valuable.
📲 Join our private channels to get more trend indicators and market information delivered directly to you. Choose your preferred channel to stay informed.
➡️Share this analysis to someone in your network who appreciates a data-driven perspective.
This newsletter is provided for informational purposes only and does not constitute investment advice or a recommendation to buy or sell any security or asset class. The views expressed are those of the author as of the date of publication and are subject to change without notice. Information presented is based on data obtained from sources believed to be reliable, but its accuracy, completeness, and timeliness are not guaranteed. Past performance is not indicative of future results. Investing involves risks, including the possible loss of principal. Readers should consult with their own financial advisors before making any investment decisions. The author and associated entities may hold positions in the assets or asset classes discussed herein.
立即加入《Joe’s 華爾街脈動》LINE@官方帳號,獲得最新專欄資訊(點此加入)
關於《Joe’s 華爾街脈動》
鉅亨網特別邀請到擁有逾 22 年美國投資圈資歷、CFA 認證的機構操盤人 Joseph Lu 擔任專欄主筆。
Joe 為台裔美國人,曾管理超過百億美元規模的基金資產,並為總資產高達數千億美元的多家頂級金融機構提供資產配置優化建議。
Joe 目前帶領著由美國頂尖大學教授與博士組成的精英團隊,透過獨家開發的 "趨勢脈動 TrendFolios® 指標",為台灣投資人深度解析全球市場脈動,提供美股市場第一手專業觀點,協助投資人掌握先機。